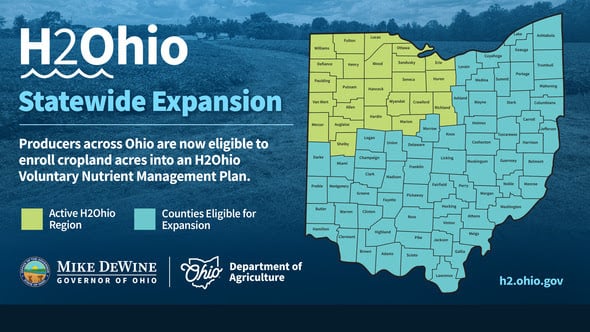
soil sample

When Jeff Duling compares recent soil tests to those taken in the past, the differences are easy to spot on his color-coded field maps. The maps show how soil nutrient levels vary in the grid blocks he tests in each field, but those variations aren’t as pronounced now as they once were. “My maps are getting to be all one color,” he said. “The highs are coming down and the lows are coming up.”

Jeff Duling
Jeff Duling holds a clump of cereal rye which is a cover crop that he plants in rows that are 30 inches apart. Corn will be planted between the rows of cereal rye.

Duling, a Farm Bureau member who farms in Putnam County, began using grid-based soil testing in the mid-1990s so he could better manage his soil fertility. Besides raising corn, soybeans and wheat, he raises hogs and cattle. Using the soil test data helps him apply fertilizers and manure where the nutrients are needed and avoid “hot spots” where nutrient levels are high. “You’re putting the nutrients where they need to be,” he explained.

Duling’s experience is an example of how farmers in Ohio are increasing soil sampling and managing soil nutrients more closely. Those trends are leading to a gradual decrease in the high soil test phosphorus levels that can lead to water quality problems.

A marked increase in soil testing since 2001

According to an analysis of soil test data by The Fertilizer Institute, the number of soil samples tested for Ohio increased from about 69,000 in 2001 to nearly 274,000 in 2020. Over the same time period, the median soil test phosphorus levels dropped from 38 to 26 parts per million (Mehlich 3).

A study conducted in 2021 by the Ohio Agriculture Conservation Initiative also showed how farmers are using soil test data. The randomized sample looked at 450 crop fields in the Lower Maumee watershed to see what practices farmers were using to manage nutrients and water quality. Of those fields, 83% were being soil tested at least once every three years and 87% of the soil samples were being done on grids or zones, to identify differences within fields. In 40% of the fields, phosphorus was applied using variable rates based on needs identified with soil tests.

Each color on this field map requires a different rate of phosphate application in order to reach the level of phosphorus that will optimize crop growth. The red area does not need to have any phosphate applied.

Greg LaBarge, an agronomic systems field specialist with Ohio State University Extension, explained that farmers have been reducing fertilizer applications on fields and areas of fields where nutrient levels are above the agronomic levels needed for efficient crop production. Even so, bringing high soil test phosphorus levels down takes time, he noted. Reducing phosphorus levels with crop removal will bring soil test numbers down only about 2 ppm per year with Ohio’s standard field crops: corn, soybeans and wheat. So, in the meantime, he recommends farmers protect water quality using conservation practices that control or treat water leaving the field.

Identifying areas with high phosphorus levels

Soil testing is the only way to identify areas with high phosphorus levels, said Duling. For instance, he used grid-based soil sampling to test a field he recently rented and found high phosphorus levels in some areas. “You have to know your farms,” he stressed. On his own family farm, he knows one hilltop has higher phosphorus because it was a convenient place to haul manure years ago.

Kris Swartz, a Farm Bureau member in Wood County, also found areas on his farm with slightly higher phosphorus levels. Those tests have been trending downward with careful management, he said. “It can be done.”

Kris Swartz
Kris Swartz

Swartz, who raises corn, soybeans and wheat, typically soil tests every other year using a zoned system based on yield maps. Although his fields have little variability in soil types, his soil tests show a wide range in pH levels. He uses variable rates of lime to correct those levels.

Nearly all retailers have the ability to apply variable rates of fertilizers, Swartz pointed out. That allows farmers to put fertilizer where it will give them an economic return without over-applying on other areas. In the past, a farmer might put a little extra out, just to be safe, he said. “Now they put it where it gets the most bang for the buck.”

High fertilizer prices

This year’s higher fertilizer prices are giving farmers even more incentive to plan their fertilizer applications carefully, Swartz added. “We all know that fertilizer prices are crazy right now. Those high fertilizer prices are probably going to help us on water quality.”

Jordan Hoewischer, director of water quality and research for Ohio Farm Bureau, also expects to see farmers using precision soil testing and variable rate application to make the most of their fertilizer investment as prices continue to increase. The trend toward more frequent and more precise soil testing is likely to continue as farmers see the value for their farms as well as for water quality. “The best tool in the toolbox is to start with the best information you can,” he said.

Although trends are showing reductions in soil test phosphorus levels, more work is needed to improve water quality, Hoewischer added. Fields that still have high phosphorus levels are more likely to lose phosphorus through runoff and tile discharge. Better use of soil tests can help target water quality protection efforts while farmers also work to reduce those soil test levels. “It’s not a mission accomplished,” he explained. “It takes a long time to turn the ship around.”

Ohio’s soil testing trends show that farmers are becoming increasingly efficient in their use of fertilizer, Hoewischer added. “We’re working against the narrative that farmers are saturating their soils with nutrients.”

Online Extra

Water quality and agriculture: the rest of the story


Labor has always been an issue, mainly because we are a seasonal operation. So that's a challenge finding somebody who only wants to work three months out of a year, sometimes up to six months.
Mandy Way's avatar
Mandy Way

Way Farms

Farm Labor Resources
I appreciate the benefit of having a strong voice in my corner. The extras that are included in membership are wonderful, but I'm a member because of the positive impact to my local and state agricultural communities.
Ernie Welch's avatar
Ernie Welch

Van Wert County Farm Bureau

Strong communities
I see the value and need to be engaged in the community I live in, to be a part of the decision-making process and to volunteer with organizations that help make our community better.
Matt Aultman's avatar
Matt Aultman

Darke County Farm Bureau

Leadership development
Farm Bureau involvement has taught me how to grow my professional and leadership experience outside of the workforce and how to do that in a community-centric way.
Jaclyn De Candio's avatar
Jaclyn De Candio

Clark County Farm Bureau

Young Ag Professionals program
With not growing up on a farm, I’d say I was a late bloomer to agriculture. I feel so fortunate that I found the agriculture industry. There are so many opportunities for growth.
Jenna Gregorich's avatar
Jenna Gregorich

Coshocton County Farm Bureau

Growing our Generation
Knowing that horticulture is under the agriculture umbrella and having Farm Bureau supporting horticulture like it does the rest of ag is very important.
Jared Hughes's avatar
Jared Hughes

Groovy Plants Ranch

Groovy Plants Ranch
If it wasn't for Farm Bureau, I personally, along with many others, would not have had the opportunity to meet with our representatives face to face in Washington.
Austin Heil's avatar
Austin Heil

Hardin County Farm Bureau

Washington, D.C. Leadership Experience
So many of the issues that OFBF and its members are advocating for are important to all Ohioans. I look at OFBF as an agricultural watchdog advocating for farmers and rural communities across Ohio.
Mary Smallsreed's avatar
Mary Smallsreed

Trumbull County Farm Bureau

Advocacy
Suggested Tags: