


Ohio Farm Bureau encouraged by results of OACI’s Auglaize River Watershed Assessment Report
The report provides insight into measurable progress in conservation practices and Ohio farmers’ continued commitment to water quality.
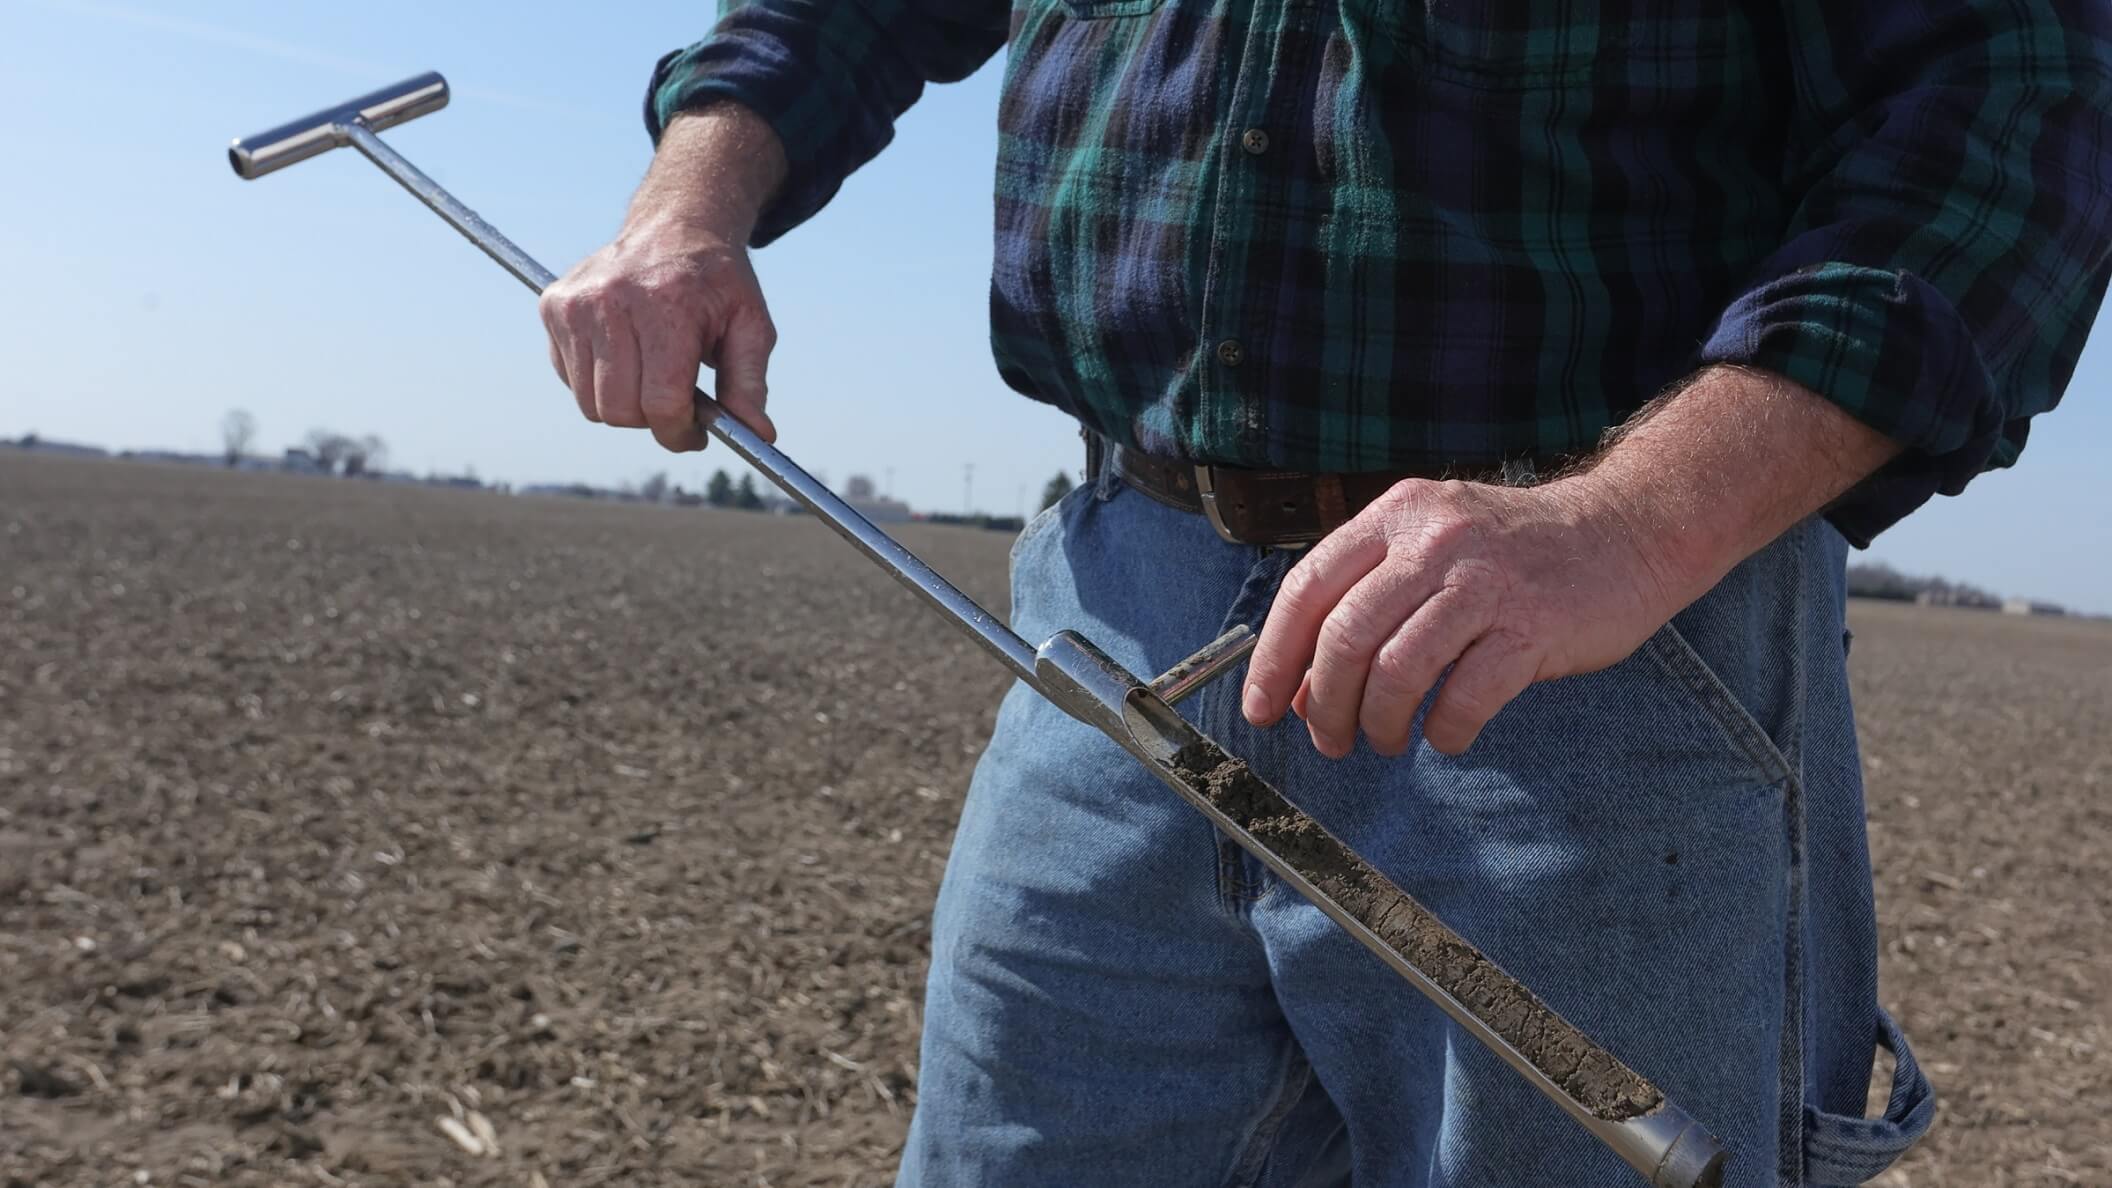
Read MoreFarmers in Ohio are increasing soil sampling and managing soil nutrients more closely, leading to a gradual decrease in high soil test phosphorus levels that can lead to water quality problems.
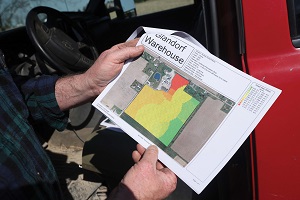
When Jeff Duling compares recent soil tests to those taken in the past, the differences are easy to spot on his color-coded field maps. The maps show how soil nutrient levels vary in the grid blocks he tests in each field, but those variations aren’t as pronounced now as they once were. “My maps are getting to be all one color,” he said. “The highs are coming down and the lows are coming up.”
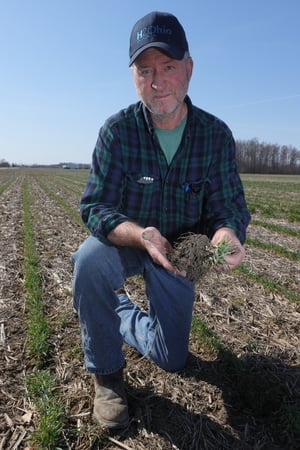
Duling, a Farm Bureau member who farms in Putnam County, began using grid-based soil testing in the mid-1990s so he could better manage his soil fertility. Besides raising corn, soybeans and wheat, he raises hogs and cattle. Using the soil test data helps him apply fertilizers and manure where the nutrients are needed and avoid “hot spots” where nutrient levels are high. “You’re putting the nutrients where they need to be,” he explained.
Duling’s experience is an example of how farmers in Ohio are increasing soil sampling and managing soil nutrients more closely. Those trends are leading to a gradual decrease in the high soil test phosphorus levels that can lead to water quality problems.
According to an analysis of soil test data by The Fertilizer Institute, the number of soil samples tested for Ohio increased from about 69,000 in 2001 to nearly 274,000 in 2020. Over the same time period, the median soil test phosphorus levels dropped from 38 to 26 parts per million (Mehlich 3).
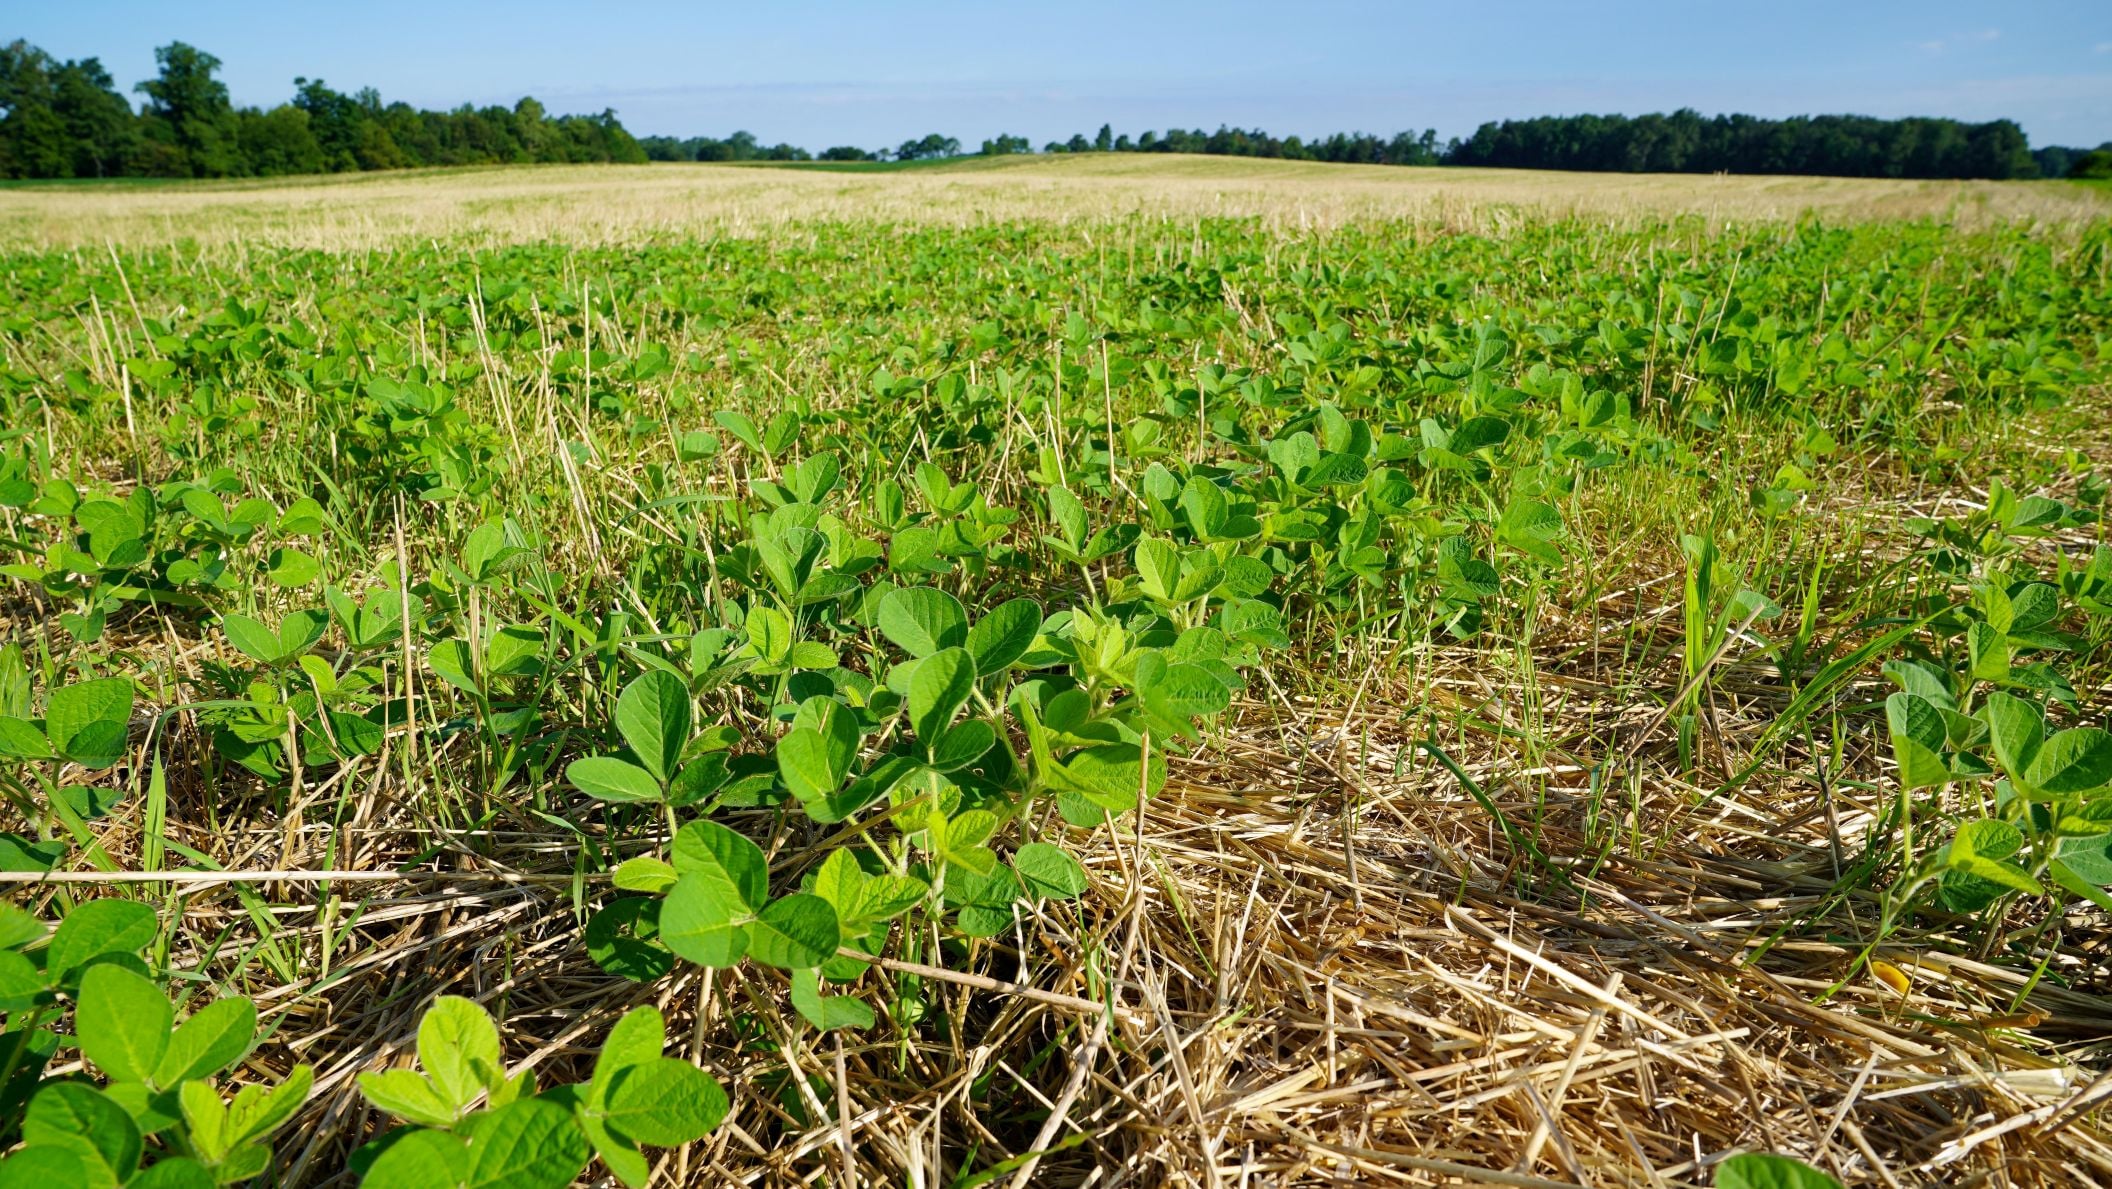
A study conducted in 2021 by the Ohio Agriculture Conservation Initiative also showed how farmers are using soil test data. The randomized sample looked at 450 crop fields in the Lower Maumee watershed to see what practices farmers were using to manage nutrients and water quality. Of those fields, 83% were being soil tested at least once every three years and 87% of the soil samples were being done on grids or zones, to identify differences within fields. In 40% of the fields, phosphorus was applied using variable rates based on needs identified with soil tests.
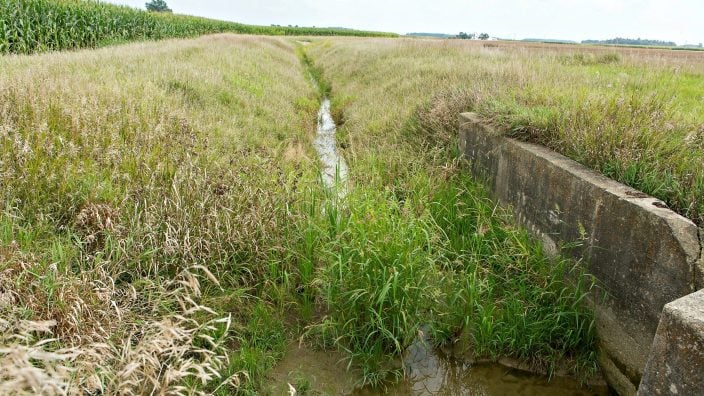
Greg LaBarge, an agronomic systems field specialist with Ohio State University Extension, explained that farmers have been reducing fertilizer applications on fields and areas of fields where nutrient levels are above the agronomic levels needed for efficient crop production. Even so, bringing high soil test phosphorus levels down takes time, he noted. Reducing phosphorus levels with crop removal will bring soil test numbers down only about 2 ppm per year with Ohio’s standard field crops: corn, soybeans and wheat. So, in the meantime, he recommends farmers protect water quality using conservation practices that control or treat water leaving the field.
Soil testing is the only way to identify areas with high phosphorus levels, said Duling. For instance, he used grid-based soil sampling to test a field he recently rented and found high phosphorus levels in some areas. “You have to know your farms,” he stressed. On his own family farm, he knows one hilltop has higher phosphorus because it was a convenient place to haul manure years ago.
Kris Swartz, a Farm Bureau member in Wood County, also found areas on his farm with slightly higher phosphorus levels. Those tests have been trending downward with careful management, he said. “It can be done.”

Swartz, who raises corn, soybeans and wheat, typically soil tests every other year using a zoned system based on yield maps. Although his fields have little variability in soil types, his soil tests show a wide range in pH levels. He uses variable rates of lime to correct those levels.
Nearly all retailers have the ability to apply variable rates of fertilizers, Swartz pointed out. That allows farmers to put fertilizer where it will give them an economic return without over-applying on other areas. In the past, a farmer might put a little extra out, just to be safe, he said. “Now they put it where it gets the most bang for the buck.”
This year’s higher fertilizer prices are giving farmers even more incentive to plan their fertilizer applications carefully, Swartz added. “We all know that fertilizer prices are crazy right now. Those high fertilizer prices are probably going to help us on water quality.”
Jordan Hoewischer, director of water quality and research for Ohio Farm Bureau, also expects to see farmers using precision soil testing and variable rate application to make the most of their fertilizer investment as prices continue to increase. The trend toward more frequent and more precise soil testing is likely to continue as farmers see the value for their farms as well as for water quality. “The best tool in the toolbox is to start with the best information you can,” he said.
Although trends are showing reductions in soil test phosphorus levels, more work is needed to improve water quality, Hoewischer added. Fields that still have high phosphorus levels are more likely to lose phosphorus through runoff and tile discharge. Better use of soil tests can help target water quality protection efforts while farmers also work to reduce those soil test levels. “It’s not a mission accomplished,” he explained. “It takes a long time to turn the ship around.”
Ohio’s soil testing trends show that farmers are becoming increasingly efficient in their use of fertilizer, Hoewischer added. “We’re working against the narrative that farmers are saturating their soils with nutrients.”
Online Extra
Water quality and agriculture: the rest of the story


The report provides insight into measurable progress in conservation practices and Ohio farmers’ continued commitment to water quality.
Read More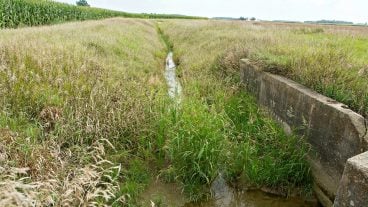
The report provides a data-driven look at conservation practices across the Western Lake Erie Basin and emphasizes farmers are doing their part in water quality.
Read More
Jay Martin of Ohio State and Jordan Hoewischer join the podcast to break down the recent research and advocacy efforts helping drive that progress.
Read More

Ohio EPA has recently proposed allowing data centers to obtain ‘general’ National Pollutant Discharge Elimination System (NPDES) permits for their stormwater/wastewater discharges.
Read More
The network was established in fall 2015 on farms in Hardin and Hancock counties. Nearly 200 different tours and events took place on the three farms totaling nearly 4,000 visitors in its 10-year span.
Read More
The 2025 algal bloom for the Western Lake Erie Basin is expected to have a severity index of 3, according to the final forecast from the National Oceanic and Atmospheric Administration.
Read More

Over 30 tour participants witnessed a variety of conservation strategies in action, including cover crops, no-till and strip-till systems, two-stage ditches, land buffers and advanced manure management.
Read More
Experts are monitoring the severity of this season’s algal bloom in The Western Lake Erie Basin. As more research is…
Read More

The Field Day podcast series will include guests from the USDA Agricultural Research Service, Ohio Department of Agriculture, The Ohio State University and the University of Illinois.
Read More

The plan provides a blueprint for policymakers and Ohio Farm Bureau members to bolster Ohio’s agriculture industry and our rural communities.
Read More